or: Yes, Week 2 of the 2015 NFL season probably was the toughest week for a survivor pool, ever.
Week 2 of the 2015 NFL season was rife with upsets, with 9 of 16 underdogs winning their games. This wreaked havoc on survivor pools (aka eliminator pools), where the object is to pick a single team to win each week. The six most popular teams (according to Yahoo! sports) all lost:
(image from Yahoo! Sports, backed up here as it looks like the URL will not be stable into next year)
About 4.6% of Yahoo! participants survived the week (I looked only at the top 11 picks due to data availability, see the GitHub file below for more details). This week left me wondering: was this the greatest % of survivor pool entrants to lose in a single week, ever? And what were the odds of this happening going into this week?
I wrote some quick code to run a million simulations of the 2nd week of the 2015 NFL season (available here on GitHub).
Results
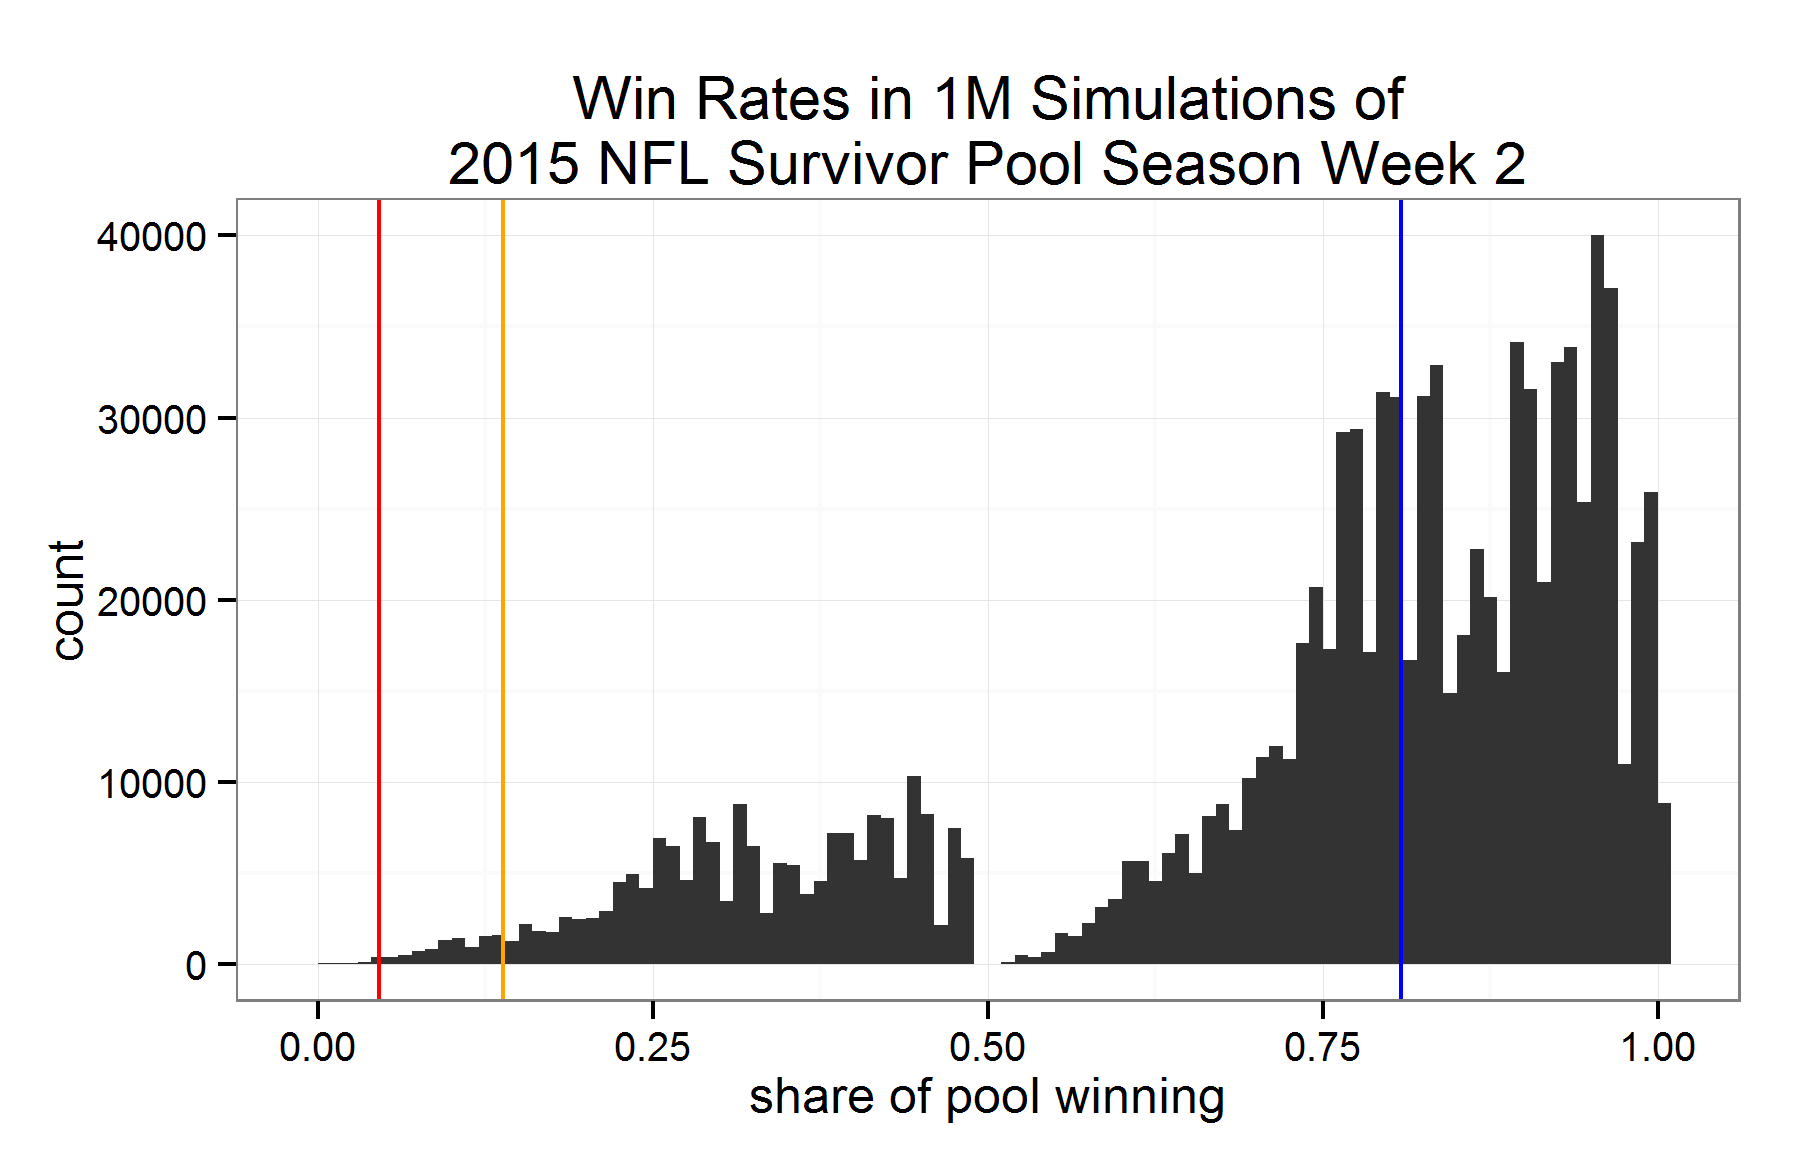
Given the projected win probabilities (based on Vegas odds) and the pick distributions, only 684 of the 1,000,000 simulations yielded a win rate below the 4.6% actual figure. Thus the likelihood that only 4.6% of entrants would make it through the week was 0.0684%, less than a tenth of one percent. Or to put it another way, this event had a 1-in-1,462 chance of occurring.
Here are the results of the simulation:
- Blue line: median expected result, 80.6% winners
- Yellow line: 1st percentile result, 13.8% winners (to give you a sense of how rare a result this week was)
- Red line: actual result, 4.6% winners
So was it the greatest week for survivor pool carnage ever? Probably. You might never see a week like it again in your lifetime.
P.S. This distribution is pretty cool, with the sudden drop off and gradual climb starting at x = 0.50. This is caused by 50% of the pool picking the Saints, the most likely team to win. I wouldn’t say this is a bimodal distribution, exactly – is there a term for this?

