Showing posts with label Asians. Show all posts

Sunday, May 16, 2021

Who is more likely to be murdered by a black offender: a white or an Asian?

 Wilfred Reilly (@wil_da_beast630) has a discussion going on at Twitter about which race currently faces the most "systemic racism." Some people are assuming that Asians are victimized by blacks more than whites are. Two sources of data are not very helpful here: hate crimes and victimization data from the National Crime Victimization Survey. Hate crimes are a tiny drop in the bucket of all violence, and you don't see NCVS tables with Asian victims by race of offender. (Let me know if I've missed them.) Victim data in general indicates that Asians face low levels of victimization, which makes sense because most crime is intra-racial, and Asians have very low rates of criminal offending. 

Perhaps homicide data is the best way to go here. I looked at expanded FBI homicide data and the Census to calculate rates for being murdered by a black person for two groups: 1) Whites/Hispanics, and 2) Asians/ Native Americans/Pacific Islanders. I'm afraid the FBI lumps people together that way. The rate for group 1 is 2.30 murders per 1 million population. For group 2, it's 1.44 murders per million. According to FBI data, blacks pose more of a threat to whites and Hispanics than Asians plus. 


Wednesday, June 03, 2020

In a sample of 59 countries, America is the 12th most racially tolerant

Sociology textbooks regularly state as if it were God's Truth that the United States is a fundamentally racist country. Let's try something different and instead of maligning a whole country, let's actually look at data.

Between 2010 and 2014, the World Values Survey asked 88,042 people from 59 countries if they would object to having neighbors of a different race.  Here are the percent who answered yes by country:

Percent objecting to a neighbor of a different race

Azerbaijan  58.1
Libya  55.1
Palestine  44.0
Thailand  39.7
Lebanon  36.3
Turkey  35.8
Ecuador  34.5
S. Korea  34.1
Yemen  34.0
Georgia  32.1
Armenia  31.8
Malaysia  31.3
Kuwait  28.1
Kyrgyzstan  28.1
Iraq  27.7
Jordan  27.2
India  25.6  
Estonia  25.4
Cyprus  24.8
Romania  23.5
Belarus  23.1
Japan  22.3
Philippines  21.6
Nigeria  20.9
Ghana  19.9
Algeria  19.8
S, Africa  19.2
Hong Kong  18.8

All Countries  18.6

Russia  17.2
Tunisia  16.9
Ukraine  16.9
Pakistan  15.7
Germany  14.8
Uzbekistan  14.0  
Morocco  13.8
Singapore  12.6
Kazakhstan  11.2
Slovenia  10.9
China  10.5
Mexico  10.2
Peru  9.3
Zimbabwe  8.9
Qatar  8.8
Taiwan  8.4
Netherlands  8.2
Haiti  6.3
Chile  5.6
USA  5.6
Poland  5.5
Australia  5.0
Spain  4.8
Rwanda  3.5
Colombia  3.2
New Zealand  2.9
Sweden  2.8
Brazil  1.9
Uruguay  1.6
Trinidad and Tobago 1.5
Argentina  1.0

So, in a sample of 59 countries, the United States is the 12th most tolerant. The percent of Americans not wanting a neighbor of another race is less than one-third the world average. Liberals should be ashamed of themselves for indicting our country. 

Whites in general are accused of being notoriously racist, but you can see that Western societies tend to be the most tolerant.  The most intolerant regions are Muslim and Asian.

Sunday, September 29, 2019

Data suggests Hispanic criminality is similar to that of blacks

Over the years, people like me have disagreed with Ron Unz that the rate of serious crime by Hispanics is not much different than that of whites.

Analysts typically rely on police or imprisonment data to estimate Hispanic/White differences, but Hispanics are significantly less likely than whites to report crimes to the police. Since Latinos are typically victimized by other Latinos (crime is typically intra-ethnic), there is an undercount of crime committed by Hispanics.

Using victim data is a method around this problem.  The National Crime Victimization Survey contacts tens of thousands of people each year to ask them about being victimized.  We can use these statistics as proxies of crime rates for various races/ethnicities. I took the estimates for 2014-2018 and averaged them since there is quite a bit of annual error, especially in a group as small as Asians.  Here are the percentages of people who were victimized by serious crime in the past year:

Percent victimized
Blacks  2.1
Hispanics  2.1
Whites  1.6
Asians  1.0
Other  3.1

See how the rates for Hispanics and blacks are the same. Prevalences for whites and especially Asians are significantly lower.

I doubt serious criminality among Latinos is exactly the same as blacks. While most crimes are intra-racial, some of the victimizations of whites, Latinos, and Asians are by blacks committing robbery or assault.

By the way, I assume that the "Other" category is mostly American Indians. Their very high prevalence is consistent with Cochran and Harpending's hypothesis that racial groups with deep histories of agriculture and powerful states experienced selection for docile and self-disciplined individuals.  Criminological research has found that criminals tend to be impulsive and disagreeable.  As people with shorter histories under agrarian states, Native Americans might have a higher percentage of these types.

Thursday, August 22, 2019

Occam's Razor demands the simplest explanation: races are internally different

Richard Lynn's new book Race Differences in Psychopathic Personality describes hundreds of studies conducted around the world. One American study that strikes me is a simple one of racial differences in doing one's homework that is described on page 61.

The mean number of hours studied per week by high school seniors looks like this: Asians, 3.9; whites, 3.4; Hispanics and blacks, 2.0.  Asian teens study roughly twice as much as other minorities.

Academic apologists work full-time concocting reasons for the racial gaps we see, but how do we blame homework differences on malevolent, discriminatory whites?  Homework is done at home with no whites looking over your shoulder. The schools provide even poor minority kids with books and materials for assignments. Parents and kids simply decide how much time gets devoted to studying.

You might respond that minority kids are given less homework because of the "bigotry of low expectations." But why do Asians do more than whites?  If you answer that schools are just following stereotypes, so schools with lots of Asian students assign more homework, it simply starts to seem like schools might respond to what students are like, or hardworking families select schools with higher expectations.

It just becomes absurd to pin these racial gaps on anything at all bad that whites do.  Again and again,  we see that whites are mediocre.  What sort of white supremacist country sorts whites into the undistinguished middle?  I want a better brand of supremacy!

After reading Lynn's descriptions on more than 700 studies from dozens of countries, Occam's Razor demands the simplest explanation: the races are internally different.
Sexual Vitality Summit

Tuesday, January 08, 2019

Data: A big drop in IQs for East Asians in the US

As I sit in this McDonald's being served coffee by a middle-aged Filipino man, I'm wondering how East Asian IQ is doing in the US.  Here is a graph showing trends since the 1970s (GSS data, US born, N = 107):


Wow, that's a significant drop. In the 1970s, the mean was 108.6.  By the 1990s, it fell to 99.3.  After an increase to 101.7 in the 2000s, it fell again to a low of 99.0 in this decade. 

I assume this drop is due to the increase of southeast Asians (e.g., Filipinos, Vietnamese) -- groups that have lower average IQs than NE Asians (i.e., Japanese, Chinese, Koreans).


Friday, July 20, 2018

New study: High rate of underweight black newborns due to genes, not racism

A new study finds that several gene variants in African-Americans help explains why they have underweight newborns twice as often as whites. For example, two of the DNA points (single nucleotide polymorphisms or SNPs) that affect birth weight vary a great deal by race; for one point, 69% of pure Africans carry the weight-lowering version, while only 2% of Europeans have it. For the other point, it was 91% for Africans and 23% for Europeans.

Now the race-deniers tell us that blacks and whites don't differ on genes, but do these percentages seem the same to you?

Next question, why would Africans frequently have genes that make their babies smaller--a trait that predicts health problems down the road?

The honest answer is, I don't know. But this does remind me of Phil Rushton's theory that blacks and whites have different "evolutionary strategies"; that evolutionary pressures have shifted blacks toward a more "quantitative" approach to reproduction, whereas whites and East Asians are shifted toward "quality" offspring--fewer of them, but greater investment in each one. Baby-enlarging genes have supposedly been selected for among whites and Asians.

Whatever the explanation, this study shows strong evidence that black newborns tend to be smaller, not because of some social disadvantage imposed by racist whites, but because of genes and evolutionary differences.    

Thursday, May 26, 2016

Asians Americans vote Democrat because they're young (and liberal)

An interesting claim was made by Tantum Malorum on Twitter (where I spend all my time these days).  He said that Asians tend to vote Democrat because they are disproportionately young.  I looked into this with GSS data. The mean age of all voters in 2012 was 52.2. Here are the means for Asian groups listed in GSS:

Mean age
Chinese  51.1
Filipino  42.6
Japanese  45.5 
Indian  48.6
Other Asian  45.0

Mean age for all groups was lower than for the total sample, although it's not much lower for Chinese Americans. Since young people tend to vote Democrat, it could be that Asians are not more inclined to be liberal, they're just younger.

Next, let's look at voting in 2012 for: 1) young Asians, and 2) older Asians. I'm going to add all Asian groups together since sample sizes are so low.

Percent voting for Romney

Ages 18-44  
All voters  32%
Asian voters  25%

Ages 45 and up
All voters  40%
Asian voters  38%

First of all, it looks like the numbers are lower than they should be. GSS oversamples women, so this might be a problem.

Anyway, 25% of young Asians voted for Romney, compared to 32% of all young people. For older Asians, there is only a two point gap with all older voters.

So, it looks like the Asian vote is tilted Democrat because they are a younger population, but they are a little more liberal as well.

The numbers are too small to make much of it, but of the Asian groups, Indians were noticeably more likely to vote for Obama.

Wednesday, June 20, 2012

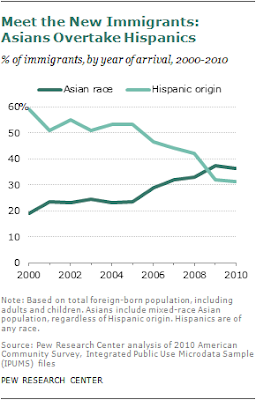
Pew: Asians now the largest group of new immigrants


According to Pew Research:
Asians recently passed Hispanics as the largest group of new immigrants to the United States. The educational credentials of these recent arrivals are striking. More than six-in-ten (61%) adults ages 25 to 64 who have come from Asia in recent years have at least a bachelor’s degree. This is double the share among recent non-Asian arrivals, and almost surely makes the recent Asian arrivals the most highly educated cohort of immigrants in U.S. history.

Compared with the educational attainment of the population in their country of origin, recent Asian immigrants also stand out as a select group. For example, about 27% of adults ages 25 to 64 in South Korea and 25% in Japan have a bachelor’s degree or more. In contrast, nearly 70% of comparably aged recent immigrants from these two countries have at least a bachelor’s degree.

Recent Asian immigrants are also about three times as likely as recent immigrants from other parts of the world to receive their green cards—or permanent resident status—on the basis of employer rather than family sponsorship (though family reunification remains the most common legal gateway to the U.S. for Asian immigrants, as it is for all immigrants).

The modern immigration wave from Asia is nearly a half century old and has pushed the total population of Asian Americans—foreign born and U.S born, adults and children—to a record 18.2 million in 2011, or 5.8% of the total U.S. population, up from less than 1% in 1965. By comparison, non-Hispanic whites are 197.5 million and 63.3%, Hispanics 52.0 million and 16.7% and non-Hispanic blacks 38.3 million and 12.3%.

Asian Americans trace their roots to any of dozens of countries in the Far East, Southeast Asia and the Indian subcontinent. Each country of origin subgroup has its own unique history, culture, language, religious beliefs, economic and demographic traits, social and political values, and pathways into America.

But despite often sizable subgroup differences, Asian Americans are distinctive as a whole, especially when compared with all U.S. adults, whom they exceed not just in the share with a college degree (49% vs. 28%), but also in median annual household income ($66,000 versus $49,800) and median household wealth ($83,500 vs. $68,529).

Thursday, March 17, 2011

White Americans like Chinese Americans more than the reverse

There has been a lot of Internet buzz about the white UCLA student who complained about Asian student behavior on campus.  She has been trashed as a hater, and OneSTDV wrote about it on his blog.

Whites get called haters for anything and everything, but how do they actually stack up against Asians?

The GSS asked a sample of Americans how warmly they feel towards: 1) whites, and 2) Asians. Answers ranged from "not at all close" (1) to "very close" (9).  The mean for whites towards Asians is 6.25. The mean of Chinese Americans towards whites is 5.58, and it's 6.52 for Japanese people. The white and Japanese means are not significantly different, but whites like the Chinese significantly more than the reverse.

Tuesday, August 31, 2010

Asian women are 30 times more likely to experience premature ovarian aging

According to this study, Asian women are 30 times more likely than white women to experience premature ovarian aging, which helps explain why they have a significantly lower level of sucess at in vitro fertilization.

Saturday, August 22, 2009

More on trust: As a follow-up to the last post, I wondered about the level of trust in Asian and Muslim countries. Based on World Values Survey data, here are the percent who say that people can generally be trusted:


Percent who say you can trust people

World 29.6

Iran 65.3
Saudi Arabia 53.0
Indonesia 51.6
Iraq 47.6
Egypt 37.9
Pakistan 27.9
Morocco 23.5
Bangladesh 22.2
Azerbaijan 20.5
Turkey 12.6
Algeria 11.2

China 55.2
Japan 42.9
Taiwan 38.2
Vietnam 41.1
India 37.9
South Korea 32.1
Philippines 7.0

Muslim countries are all over the place--they are about as diverse as the whole sample of countries. Numbers like that in Iraq surprise me, given what Steve Sailer has written about how consanguinity in Muslim countries undermines trust beyond the family.

India is the trusting one among South Asian countries. The Phillipines is the exception in Southeast Asia, and East Asia is trusting.

Sunday, July 19, 2009

East Asian IQ: Cavalli-Sforza hypothesized in The Great Human Diasporas that East Asians have high IQs scores because: 1) parents push their children more in academics; and 2) the children have to learn Chinese characters which boosts performance on IQ tests.

We can test the idea by comparing the IQs of East Asians in their own countries with children educated in an English-speaking country. We would expect Asian parents to encourage their kids in both kinds of countries, but we wouldn't expect Asian children to be mastering Chinese characters in English-speaking schools in Western countries.

According to the averages of several studies summarized by Richard Lynn in IQ and Global Inequality, people in China and Japan average IQs of 105; the mean is 106 in South Korea. The first study I found on Asian IQ was an Australian study (Justine Dandy and Ted Nettlebeck. Educational Psychology, Vol. 22, No. 3, 2002. The Relationship Between IQ, Homework,Aspirations and Academic Achievement for Chinese, Vietnamese and Anglo-Celtic Australian School Children.) Chinese Australians had a mean IQ between 108 and 109.

Now one would expect immigrants to have IQs higher than the average in their mother countries, but we would also expect to see regression toward the mean among their children. I don't see evidence here that failing to learn Chinese characters is hurting anyone.

Tuesday, March 25, 2008

Asian Americans are seen as different: As a follow-up to my earlier post on which ethnic groups are seen as most similar to one's own, I examined General Social Survey data for more than 1,200 Americans to see which ethnic group is perceived to be the least like one's own group. As before, the choices were white, Jewish, black, Hispanic, Asian, and all equally the same, or none is similar. It turns out that Asians are thought to be the most different by all groups except one:


Percent who say that they have least in common with Asians

Whites 33.5
Blacks 40.4
Jews 32.4
Mexicans 31.1
American Indians 32.0

All Americans 34.0

The number shown above for Mexicans is the only one that is not in first place: 37.8% of Mexicans said they had least in common with Jews.

So why does everyone think Asian Americans are so different? You might answer that they are not Christians, but many are Christians (e.g., almost all Filipinos) and anyway Jews are not Christians. Asians look a little like American Indians and Mex-Ams, so looks don't seem to be what people are focusing on. Perhaps East Asian cultures seem alien. Other ideas?

Are gun owners mentally ill?

  Some anti-gun people think owning a gun is a sign of some kind of mental abnormality. According to General Social Survey data, gun owners ...