Showing posts with label Ethnicity. Show all posts

Wednesday, July 12, 2023

Which race has the most people with antisocial personality disorder?


Face-to-face interviews were conducted with 36,309 respondents in the 2012-2013 National Epidemiologic Survey on Alcohol and Related Conditions–III. I was surprised that this study published the percent of each racial/ethnic group that has antisocial personality disorder (ASPD). Having ASPD is closely related to being a psychopath. 

Natives have the highest rate -- 11.9%. Blacks are second with 5.3%. Asians are at the bottom with 1.9%. So the Native rate is 6.3 times that of Asians. 

The heritability of ASPD is around 50%.

This CDC table shows that the Native homicide rate is high (the victim rate is a proxy for the offender rate) but the Black rate is higher. Why would that be if ASPD is more common among Natives?


It could be that Blacks tend to live in urban settings, while Natives are more likely to be rural. Urban life seems to be conducive to crime. Cities enable a critical mass of antisocial individuals to come together and form gangs that produce more crime than would be committed by solitary individuals. 

The high Native rate seems consistent with Harpending and Cochran hypothesis that groups with weak histories of agrarian life, which selects for submissiveness, will tend to be more disagreeable.

Monday, May 03, 2021

Which low IQ groups have low arrest rates?

DGo (@Go321) on Twitter wondered which lower IQ groups still manage to be well-behaved as groups. Criminality is a decent measure of behavior, so I looked at General Social Survey data to see which groups with low average IQs also have lower than average arrest rates: 


The percent arrested for the whole country is 12.7%. The groups listed above with an arrest rate lower than that are: Filipinos, West Indians, and Non-Spanish West Indians. And let me add that these three groups have IQ means that are not very low: 96.7, 98.8, and 95.9, respectively. 

Most lower-IQ groups have high arrest rates, as expected.

UPDATE: After checking, I see that Arabs do not have a low mean IQ: it's 102.   


Thursday, February 18, 2021

What is the mean IQ of whites who say their ethnicity is "American only"?

Based on the General Social Survey, if you ask Americans where their families originally came from, they will typically give you an answer. But about 1% of whites and 13% of blacks will tell you they are "American only." 54% of whites who give this answer live in the South, and Americans of Scots-Irish ancestry are known to sometimes give this answer. By contrast, "American only" blacks are concentrated in the mid-Atlantic and East North Central regions. 

And their mean IQs? 


Wow, it's around 90 for whites. That is low. 

I wouldn't generalize these findings to the Scots-Irish. Many of the whites, and perhaps some from other races, who say "American only" are probably from lower IQ families who simply have not kept track of where their people are from. Or lower IQ people might be more likely to prioritize their American identity. 


Saturday, October 24, 2020

Race trumps: Race, not social class, predicts 2016 voting

You often see the argument that the central political divide is social class, not race and ethnicity. If this were true, then we should see it in voting patterns. 

The General Social Survey asked participants who they voted for in 2016, and they also asked about annual income and race. The results below are estimates from a logistic regression model that predicts 2016 voting for President with income and race. The three racial categories are white, black, and other race. Whites are the reference category and so are omitted from the model (sample size = 1,360).


From the p-values (probability) you can see that, once you adjust for race, REALINC (inflation-adjusted income) does not significantly predict who you voted for in 2016. By contrast, blacks and people of other non-white races were less likely than whites to vote for Trump, regardless of one's social class. 

Race trumps.  

Saturday, March 21, 2020

What explains the tremendous cross-national variation in religious devotion? IQ? Race?

If you're like me, you could use a break from all the coronavirus, stuff, so let's focus for a moment on race, IQ, and religion. The 2010-2014 World Values Survey asked 88,042 around the world whether they were religious, not religious, or atheist. Here are the percentages listed by country who answered that they were religious:

Percent religious

Pakistan    99.7
Georgia   97.1
Ghana   97.0
Nigeria   95.9
Rwanda   95.9
Qatar   93.8
South Africa   90.7
Haiti  90.3 
India  88.8
Armenia  88.5
Yemen   86.3
Poland   86.2
Turkey   83.5
Colombia  82.5
Morocco   82.4
Peru   81.5
Romania  81.4
Philippines   80.7
South Africa  80.0
Brazil  79.7
Trinidad and Tobago  78.8
Cyprus   78.3
Iraq   76.8
Algeria   74.2
Mexico   74.2
Azerbaijan  73.2
Palestine  72.4
Ecuador   71.1
Libya   68.5
Ukraine   68.3
Argentina   67.8
USA   67.0

Total Sample  66.7

Tunisia   65.1
Slovenia   64.2
Lebanon   63.6
Belarus   62.2
Kazakhstan   61.7
Malaysia   53.7
Russia   53.1
Singapore   53.1
Uruguay   50.8
Chile   50.3
Germany   49.5
Uzbekistan   48.7
Netherlands    43.8
Taiwan   43.3
Netherlands   43.8
New Zealand   42.7
Spain   40.0
Thailand   32.0
Sweden   31.2
Estonia   30.9
Japan   20.9
Hong Kong  19.8
China  12.5

First, the world is quite religious: two-thirds of the total sample described themselves this way. On the other hand, there is tremendous variation. Almost all Pakistanis are religious, while few Chinese are.

On the issue of race, noticeable patterns emerge. South Asians and blacks tend to be very religious, and while the numbers here suggest Islam is associated with greater religiosity, countries like India, Ghana, and Rwanda show that South Asians and blacks do not need to be Muslim to be highly religious. The least religious country with lots of blacks is Trinidad and Tobago, but it is still well above average.

On the other end, East Asians are typically secular. China is at the bottom with 12.5% religious. Filipinos are the exception. This raises the importance of IQ in explaining religiosity. Depending on the estimate, mean IQ for the Philippines is between 74 and 86, and research clearly shows that lower IQ people tend to be more devout.

Europeans vary a lot with levels from 97.1% in Georgia down to 30.9% in Estonia.  Historical factors are important, but a virtue of focusing on IQ is that it helps simplify the world--a major goal of science. Estonians, for example, have a mean IQ of around 100, while it is in the low to mid-90s in Georgia.

Muslim-dominated societies vary quite a bit, too, from 99.7% religious (Pakistan) to 48.7% (Uzbekistan). IQ appears to be a little higher in Uzbekistan. Malaysia, another somewhat secular,  Muslim-dominated country (53.7% religious) has a mean IQ somewhere in the low-to-mid 90s. Overall, Muslim countries are religious.

Latin Americans countries are also fairly devout. On the high end, 82.5% of Colombians are religious, and on the low end, 50.3% of Chileans. Again, IQ might help explain the pattern: it's in the high 80s in Chile, but the low 80s in Colombia.

It looks like any association between race, ethnicity and religious devotion is, in large part, simply a reflection of differences in IQ.  The simple three-race categorization works very well: blacks (low IQ/high religiosity), whites (medium IQ/medium religiosity), and East Asians (not Filipinos) (high IQ/low religiosity). We could add South Asians as well (low IQ/high religiosity).


Sunday, January 12, 2020

Are religious people more ethnocentric?

Does loyalty to one group you belong to predict loyalty to other groups?  I suspect that religious people are also more likely to value their ethnicity.  The General Social Survey (GSS) asked people how important their ethnicity is to them with answers ranging from unimportant (1) to very important (4). 

I categorized people as not religious if they attend religious services no more than once per year. All others I lumped into the religious group. The means for thinking ethnicity is important to you are listed below--the means for the religious in parentheses, the means for the irreligious without parentheses (sample size = 2,110)

"My ethnicity is important to me"-- means

American Indian  3.50  (3.50)
Black  3.47  (3.53)
Chinese  3.40  (3.75)
Mexican  3.22  (3.47)
Puerto Rican  3.19  (3.60)
Italian  2.85  (2.72)
Jewish  2.76  (3.26)

Total  Sample  2.60  (2.84)

Scottish  2.55  (2.44)
Irish  2.45  (2.60)
German  2.35  (2.50)
Swedish  2.29  (2.67)
Russian  2.25  (2.95)
English/Welsh  2.21 (2.50)
Polish  2.13  (2.67)

For most of the ethnic groups, ethnocentrism is higher for the religious group. The differences are generally not large but look, for example, at how religious Swedes are almost as ethnocentric as secular Jews.

The difference at the extremes is large: the gap between religious Chinese Americans on the high end and the irreligious Poles on the bottom is well over one standard deviation. The typical Chinese person who goes to church says his ethnicity is 'moderately' or 'very important.' Compare that to the average Polish American who is not religious: he says his ethnicity is 'slightly important.'

Saturday, December 21, 2019

What's most important for identity--race or religion?


The view of many human biodiversity (HBD) people is that genes are a critical determinant of human behavior and culture, and the power of genes gets expressed at the individual, family and ethnic/racial levels. The contention that race as a genetic reality is a tremendous social force is, of course, the most controversial.

In a recent piece published at Unz.com, E. Michael Jones challenges this view by arguing that the key distinction among Americans is religion, not race.  While some HBD-ers contend that the fundamental conflict is racial, and old-time Marxists would argue that it's class, Jones sees the central struggle between the alliance of Protestants and Catholic versus Jews. He would update his view to include the growing presence of Muslims, but he sees people with no religion as lacking an identity, as being social nobodies, and since nature abhors a vacuum, the irreligious are drawn to identity politics. So it sounds like Jones is acknowledging the growing power of non-religious identities like feminist, gay, racialist, etc.

One way to measure identity is to look at marriage: If religion is really important to you, you will probably marry someone of the same faith.  Using General Social Survey data, I looked at the percentage of people who marry inside their group. I include ethnicity (i.e., where your family originally came from) as well as current religious affiliation. Religious denomination is shown in bold.

Percent who married within their own group 

Blacks  90.4
American Indian  87.5
Asian Indian  86.4
Protestant  86.3
Southern Baptist  83.6
Lutheran Missouri Synod  82.8
American Lutheran  81.9
Chinese  80.8
Orthodox Christian  80.0
Mexican  79.7
Jewish  79.5
United Methodist 79.1
American Baptist  77.8
Catholic  76.8
United Presbyterian  73.4
Episcopalian  73.2
Japanese  68.8
Puerto Rican  67.6
Filipino  66.7
No religion  42.9
Greek  38.9
German  37.6
Dutch  34.4
English/Welsh  34.0
Russian  32.1
French Canadian  31.5
Spanish  29.8
Irish  27.6
Polish  27.3
Norwegian  21.6
Czech  18.5
Austrian  14.8
Danish  12.5
Scottish  12.5
Swedish  11.7
French  9.4
Swiss  8.3

Keep in mind that many of these people got married a long time ago, so with the recent decline in religiosity, the numbers for religion shown here are probably high.

Having said that, the most endogamous groups tend to be non-whites followed by religious denominations. White ethnicities, even those of a putatively ethnocentric bent (e.g., Greeks, Irish), are the least likely to marry within the group. As sociologists predicted some time ago, white ethnics are simply becoming whites. But the intermarriage rates of whites with Asians and Hispanics (about 60% of inter-racial marriages are between whites and Hispanics or whites and Asians) and the lack of voting as a bloc suggest that white consciousness is pretty weak.

Even though the Protestant endogamous rate is high, I'm skeptical that this is as meaningful as Jones thinks. As a Catholic, he may think they're all the same, but who really identifies as a Protestant? As a Southern Baptist, yes. As a Mormon, yes. There is very little common identity and unity among Protestants. For one thing, there is a major divide between conservative Evangelicals and liberal Christians.

Jones makes a good point that religion is an important source of identity for many Americans, but he overstates the case. Non-whites are growing in number in the US, and for them race is important.  As religion declines, people are developing political identities--progressive, feminist, sexual minority, or racialist. Jones says that "Logos is Rising"--that Catholicism is growing.  According to the data, "Raza is Rising."

Sunday, December 15, 2019

Are Mexican immigrants less tidy than others?

The debate continues on Twitter about whether Hispanic immigrants tend to litter more.

On a related issue, General Social Survey interviewers rated the homes of respondents in terms of cleanliness from 'very clean' (1) to 'dirty' (5).  I calculated the means for those born in the US and those who were not (sample size = 7,062). The mean for native-borns is 1.96, the mean for immigrants is 1.86, so immigrants are not messier, they're cleaner.

What if we look by ethnic group and immigrant status? Let's limit the analysis to groups with at least 100 respondents. I'll put immigrant means in parentheses.

Mean unclean house score

Blacks 2.17  (2.02)
Mexican  2.00 (2.05)
Irish  1.98 (1.60)
Scottish  1.95 (1.89)
German  1.88 (1.68)
English/Welsh  1.84 (1.68)
Polish  1.84 (1.55)
Italian  1.77 (1.89)

Immigrants tend to be cleaner than native-borns. Mexican and Italian immigrants are the exceptions with slightly higher means than their American-born counterparts. On the question of Mexican immigrants, their score is only surpassed by blacks.

UPDATE: As I indicated, the debate actually focuses on Hispanics, not just Mexicans. The mean for all Hispanic immigrants is 1.90. For native-born Latinos, it's 2.03--a mean that is very close to that of Mex-Ams, and is only surpassed by blacks.


Wednesday, October 16, 2019

Does IQ explain crime among blacks and Hispanics?

Criminological research usually finds that crime is most common among people with IQ's around 90.  Samples, however, are predominantly white.  Does the IQ finding hold for non-whites?

The General Social Survey (GSS) asks respondents (American adults) if they have ever been arrested, and it also gives a vocabulary quiz that can be used to measure IQ. 

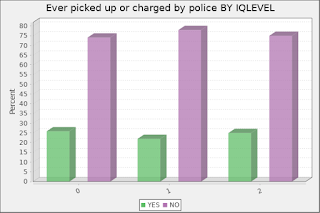
Since the sample size for Hispanics was small (92) I created only three IQ levels: 1) less than 83 (low), 2) 83-97 (low-medium), and 3) over 97 (above average).  The graphs show the percent ever arrested by IQ level:

Whites (n = 3,100)


For whites, involvement in crime is highest among the low-medium group (16.9% arrested). This is what studies usually find.

Blacks (n = 699)
For blacks, roughly 17% of respondents at all IQ levels report having been arrested. (Keep in mind that blacks tend to under-report contact with police. I don't know if this tendency varies across IQ levels).

Hispanics (n = 92)


The low-medium IQ group has the lowest arrest rate among Hispanics.  Around 25% of the low and high groups report an arrest.

In sum, IQ helps explain crime among whites, but it does not predict crime like you'd expect among blacks and Latinos. Above-average individuals are at least as likely as the unintelligent to be involved in crime. 

Monday, April 29, 2019

Data: Dot Indians are the most industrious Americans. Feather Indians, the least. Hispanics are in the middle.

Sociologists assume that a man lacking a job is the fault of the economic system. He would take any job if it were simply available.  Common sense and behavioral genetic research contradict this. Industriousness is largely caused by genes, and people vary a great deal in this trait. Some people cannot take it easy, and some cannot not take it easy. I've talked to many people over the years who refuse to take jobs that are not acceptable to them.  That's the reality in America. Sure, you might have a small percentage with REAL health problems, but those are the exceptions. 

So I'm going to use full-time work as a measure of industriousness.  I'm interested in racial and ethnic differences. Men and women still differ in employment, so let's focus on just the men. Here are the percentages of American men ages 30-64 who are employed full-time listed by ethnic group:

Percent employed full-time

Asian Indian  85.0
Jewish  84.0
Dutch  84.7
Portuguese  82.6
Japan  82.2
Russian  81.8
Spanish  81.8
Greek  81.6
Romanian  80.0
Polish  79.3
German  79.1
Mexican  78.7
Italian  78.6
West Indian  78.6
Danish  78.5
Norwegian  77.6
Austrian  77.5
Scottish  77.5
Chinese  76.9
Hispanic  76.9

US Total  75.7

Irish  75.7
English/Welsh  75.4
Czech  74.8
Swedish  75.3
French Canadian  75.1
Belgium  75.0
Arab  74.7
Hungarian  73.5
French  72.9
Filipinos  71.4
Muslim  71.2
Puerto Rican  68.6
Black  67.4
Lithuanian  67.4
Finnish  66.7
American Indian  55.6

Looks about right. For a moment, let's compare the top group with the lowest. If it were true that discrimination determines who works, why would Asian Indians surpass every single white group?  Wouldn't a bigot choose the lamest white person over a South Asian?  While American Indians are also non-whites, at least most of them are Christians. Wouldn't a bigot choose a Christian over a heathen Hindu?  American Indians have a tragic history, and whites feel bad about that. They were here long before Europeans. Wouldn't an employer choose a Real Red American over an immigrant invader, just off the boat?

And yet, Asian Indians tower over all other groups. Why? Because biology explains better than sociology.

By the way, I'm at a cafe, and seated at the next table over is a Native American. He's super friendly. He's always here, and I'm not sure he's old enough to be retired, but he doesn't seem particularly busy. The Asian Indian guy I always see here is also popular, but he owns a business and uses the cafe to network.

Friday, December 07, 2018

Data: Are lighter-skinned Hispanics smarter than those with a darker tone?

The General Social Survey (GSS) had interviewers rate the skin tone of respondents from 1 (lightest) to 10 (darkest). This can serve as a rough proxy of European ancestry. GSS also gave them a ten-question vocabulary quiz which is highly correlated with verbal IQ.  I limited the analysis to Hispanics born in this country who self-identified as white (N= 185).

The correlation between IQ and skin tone is -.28, which indicates a medium-strength association between European ancestry and higher intelligence. 

Tuesday, September 18, 2018

My son's first stab at un-PC punditry

Indulge me in taking pride in my young boys for a second.

In the car tonight, the boys were telling some politically incorrect jokes, so I told them they were funny, but they need to be careful what they say around teachers and minority students. I told them minority kids can get very angry at that kind of kidding.

The older boy then said, "What's the big deal? I wouldn't care if they joked about me being white." So I asked him what the answer is. He thought for a second and said, "I wouldn't care because I don't see anything bad about being white. People get upset when you make fun of a weakness of theirs. Minority kids must think there is something bad about being a minority. Nobody likes to hear the truth."

Interesting answer.

Addiction Summit

Wednesday, June 20, 2018

Group differences in gonorrhea

This new study examines US patterns of gonorrhea from 2000 to 2015. In 2015, there were almost 400,000 cases reported. Over the 16-year study period, there were 21 million cases. There are two distinct epidemics currently occurring in the US: one among young black heterosexuals, and one among men who have sex with other men (MSM). (Can we attach some meaning to the fact that MSM also stands for 'mainstream media'?)

Hispanics have an infection rate that is 1.8 times higher than among whites. For blacks, it's 9.6 times higher than for whites. Even though MSM's are a tiny sliver of American men, they account for 67% of all infections in males.

The authors claim that one's number of sex partners is an inadequate explanation for what we see. I'm sure there are other factors (e.g., differences in condom use), but gonorrhea rates have got to be an alternative to measuring sexual behavior with self-reports. Surveys don't indicate such enormous group differences, but the pattern of disease suggests that compared to straight white people, blacks and MSM's get around.

Sunday, June 17, 2018

Black-white differences in glaucoma

Glaucoma is a progressive condition caused by a combination of genetic and environmental factors and is the leading cause of irreversible blindness worldwide. Primary open-angle glaucoma (POAG) is the most common form of glaucoma and is often associated with elevated intraocular pressure (IOP).

The additive heritability of POAG ranges from 24 to 42%. This new study analyzes data on 4,986 POAG cases and 58,426 controls from 4 race/ethnicity groups. The authors found 24 loci linked to POAG.

The authors found more than double the prevalence of POAG among African-Americans compared to whites--16.1% vs. 7.4%. (The prevalence for East Asians was 9.9%; for Hispanics, it was 7.9%). The figures below shows the relationship between genetic ancestry and POAG. 


Hold it--I thought, as Jonathan Marks instructs us, that race is a cultural and political phenomenon, not a biological one?

Monday, August 07, 2017

Race and gang membership

I ran across this self-report study of youths in seven cities. According to my calculations, Hispanics are 3.3 times as likely to be gang members as whites. For blacks, it's 3.1 times more likely. And these estimates include a lot of wannabe gangsters, so the racial/ethnic gaps are likely to be larger among serious gang members. Not surprisingly, the researchers find that members of gangs commit a lot more crime than people not in gangs. Gangs are not just social clubs. 

Friday, August 04, 2017

Another look at ancestry and IQ

It's been a few years since I looked at verbal IQ data listed by ethnicity. It's important to look at recent data since so many immigrant groups have such small samples sizes, estimates are not very reliable. Using GSS data, here is the ranking of scores to a 10-point vocabulary quiz--a quick measure of verbal IQ. I omitted people not born in the US since the quiz is biased against non-native speakers:

Vocabulary Ranking by Ancestry

Austria   7.27
Russia    7.12 
Lithuania   7.08
Romania   6.95
Denmark   6.85 
England/Wales   6.84
Hungary    6.78
Scotland   6.75
Yugoslavia   6.73
Sweden   6.71
China   6.70
Norway   6.68 
Switzerland   6.65
Arab   6.61
Finland   6.58 
Greece   6.53
Czech   6.56
Ireland   6.46 
Poland   6.46
Japan   6.47
Italy   6.42
France   6.34
French Canadian   6.30
Germany   6.29
Belgium   6.28
West Indies   6.19
Portugal   6.18
Netherlands   5.99
Philippines   5.84
Spain   5.83
India   5.53
American Indian   5.31
Africa   5.16
Mexico   5.00
Puerto Rico 4.99

The pattern hasn't changed much since the last time I looked. What jumps out at me: 1) Mex-Ams and Puerto Ricans are still at the bottom, even lowers than blacks; 2) recent data indicates that American Muslims might assimilate better than European Muslims--the data here indicates that US Arabs are pretty smart; 3) Asian Indians (n = 40) still have a low average despite their reputation for intelligence; 4) it looks like southern Europeans don't do as well as northern Europeans (but Romania and Yugoslavia are high); and 5) central and Eastern Europeans might get a boost toward the top of the list by the large numbers of Jews (with a mean of 7.56) among their ranks.

And if you're thinking, this is just all environment, you're wrong: According to this meta-analysis, vocabulary is 62% genetic among children, and it is certainly higher than that among adults.

Oh, and if you think the differences are no biggy, again you're wrong: The gap between the top and the bottom is huge: well over 1 standard deviation. 


Sunday, April 24, 2016

Race is more powerful than income

Marxists tell us that money is more powerful than anything else. I'm not so sure. Watching the primaries has reminded me of the power of race.

Which predicts voting patterns better: income or race/ethnicity?  I want to compare all large ethnic groups in America, so let's choose Americans (like myself) of English descent as our comparison group since they were mostly likely to vote for Romney in 2012. For the first comparison, let's look at blacks. I ran a regression that includes this racial dichotomy along with income as predictors, voting for Obama over Romney as the outcome variable, and I list the standardized coefficients below:

Black  .60
Income  -.05

Income does not predict voting, but race is an extremely powerful predictor: Blacks were MUCH more likely than English-Americans to vote for Obama. Let's do those of Chinese descent next:

Chinese  .13
Income  -.08

Being Chinese (instead of English) had a stronger effect: It predicted voting for Obama more strongly than did poverty. Now let's look at an important ethnic group: Jews.

Jewish  .23
Income  -.09

Even with the small racial difference, being Jewish rather than English was a much better predictor of voting behavior than income.  We're getting the picture here that race is a more powerful determinant of behavior, at least in the context of politics.

Here are the results for the other racial comparisons (all groups are compared with Americans of English descent):

Mexican  .39
Income  -.13

Japanese  .12
Income  -.13

Asian Indian  .23
Income  -.10

Puerto Rican  .21
Income  -.11

West Indian .13
Income  -.13

Arab  .07
Income -.12

American Indian .18
Income  -.15


You can see that for Mexicans, Asian Indians, Puerto Ricans, and American Indians, race determines political orientation more than income. Race is just about as powerful as class for the other groups.

Economic determinists would predict that the race-voting correlation would disappear when income is controlled, but we see that income is the weaker influence.  Removing the effect of income, minorities seem to vote out of fear, as if their security or values might be undermined if Republicans get too much power.  (I didn't control for urbanness which might be another factor.)


Wednesday, November 02, 2011

Ethnicity and camping

Half Sigma has observed that black folks don't enjoy nature. The General Social Survey asked Americans if they've gone camping in the past 12 months. Here are the percentages who answered yes by ethnic group:


Percent who camped in past year

Norwegian 66.7*
Dutch 52.9
Irish 52.4
Mexican 50.0
German 50.4
English/Welsh 46.7
Polish 46.2
Scottish 46.0
Italian 45.8
Russian 44.0
Jewish 40.6
Swedish 37.5
American Indian 13.3**
Blacks 10.7**

*significantly above average
**significantly below average


Blacks are at the bottom of the list. American Indians are next which is pretty ironic. Perhaps sleeping in a teepee isn't camping, it's home. 

Half Sigma also claims that working-class whites love nature. I think he's right. (My blue-collar parents practically live in the wild.) We'll look at the data next.

Monday, October 31, 2011

Ethnicity and nihilism

I calculated mean nihilism scores by ethnic group. (The question is about agreement that life serves no purpose, sample size = 3,051):

Mean nihilism score

Mexicans 1.93*
Filipino 1.80
Polish 1.78*
Puerto Rican 1.74
Czech 1.73
French Canadians 1.69
American Indian 1.68
Blacks 1.59
Swiss 1.58
Danish 1.57
Hungarian 1.55

Average 1.55

French 1.51
Italians 1.51
Asian Indian 1.50
Spanish 1.50
Germans 1.50
Chinese 1.50
Scottish 1.48
Jewish 1.48
Dutch 1.47
English/Welsh 1.47
Irish 1.48
Yugoslavs 1.40
Norwegian 1.40
Swedish 1.36**
Russian 1.35
Greek 1.33**
 
* significantly above average
** significantly below average
 
Data analyses on this blog have revealed again and again that Mexican Americans are in many ways a distinctive group. The gap between them and Greek Americans is large--three-quarters of a standard deviation. One reason why farm workers are nihilistic (as we saw in the previous post) is because they are disproportionately Mexican.

Friday, April 08, 2011

Racial identification among whites by ethnic group

MIDUS Study participants (all Americans) were asked how closely do they identify with their race. Answers were scored like this: very closely (4), somewhat closely (3), not very closely (2), not at all (1). I calculated the means for whites by ethnicity:

Mean racial identfication score (sample size = 4,088)

Greek 3.45
Mexican 3.40
Jewish 3.38
Polish 3.32
Dutch 3.29
Hungarian 3.27
Italian 3.26
Russian 3.23
Lebanese 3.20
Swedish 3.20
Irish 3.19

All whites 3.18

English 3.17
German 3.17
Scottish 3.16
French 3.11
Portuguese 3.00
Czech 2.92
Spanish 2.87


Looking at all whites, the typical person is somewhere between identifying somewhat closely and very closely with his race.  The difference between Greek and Spanish Americans is sixth-tenths of a standard deviation--a pretty big gap.

There might be a tendency for the pride among minorities like Greeks, Jews, and Mexicans to spill over into racial identification. Ethnic pride might facilitate racial pride.

Are gun owners mentally ill?

  Some anti-gun people think owning a gun is a sign of some kind of mental abnormality. According to General Social Survey data, gun owners ...