Showing posts with label Voting. Show all posts

Sunday, February 21, 2021

Is Douthat right that Rush ruined the GOP?

Ross Douthat wrote in the NYT recently that the declining appeal of the GOP is the fault of Rush Limbaugh. He claims that Republicans were a 55% proposition during the Reagan Era because the message of conservatism was preached by well-bred men like William F. Buckley. Rush came along and turned conservatism into something angry and strident and that only appeals to 45% of voters. 

If Ross is correct, we should see greater support for Reagan among racial minorities--the groups we have a hard time winning over. After all, Buckley was a leading advocate for conservatism during that time and Rush was unknown.

Using the General Social Survey, we can compare minority deficits over time. I calculate this as the percent of a racial minority voting for the GOP presidential candidate minus the percent of all voters who cast a vote for the Republican candidate.

Minority deficit

1980
Blacks  -39.2
Mexicans  -18.2

1984
Blacks  -48.3
Mexicans  -19.5

Damn, impressive: under Buckley and Reagan sophistication, Blacks and Mex-Ams supported the GOP by only 18 to 48 points less than the general population! The power of positivity!

And since then? Bush Sr. wasn't strident. Perhaps he did better.

1988
Blacks  -41.9
Mexicans  -26.2

1992
Blacks  -34.6
Mexicans  -18.1

1996
Blacks  -26.2
Mexicans  -12.1

The numbers are slightly less bad with grumpy Dole. 

2000
Blacks  -42.5
Mexicans  -6.5

It looks like angry Rush didn't chase away Mex-Ams in 2000.

2004
Blacks  -37.6
Mexicans  -11.7

2008
Blacks  -34.7
Mexicans  -15.3

2012
Blacks  -33.3
Mexicans  -17.8

2016
Blacks  -38.2
Mexicans  -19.7

The Republicans did no better among minorities before strident Rush became influential in the early 1990s. 

Douthat ignores the obvious: the GOP is struggling because there were fewer than 20 million Hispanics during the Reagan Era. In 2021, there are more than 60 million--and this perennially poor group likes generous social programs and is susceptible to anti-white propaganda like all non-white groups. And probably will be for a very long time. 


Tuesday, December 29, 2020

Should we trust the voter rolls? Hell no, eight states have more registered voters than people eligible to vote

In the previous post, I presented evidence that more people voted in 2020 than the total number of registered voters. One criticism is that we should not rely on surveys but government data to estimate the total number of registered voters. 

Using this data on state counts of registered voters and this website that calculates the total number of people in a state who are eligible to register, I constructed the table shown below that displays the number of registered voters as a percent of those eligible to vote. 

You can see that eight states have more registered voters than people eligible to vote, clear evidence that the voter rolls are wildly inaccurate. Another ten states have 95-99% of all eligible people registered which seems highly implausible. Does it make sense that 19 out of 20 eligible people are currently registered? Many states have a serious problem.

As we move down the table, the numbers get more and more plausible. Eight out of ten of all eligible people currently registered? Okay, maybe, but only four states are below that cutoff. 

It seems clear that the rolls in many of these states are larded up with outdated registrations, and the Current Population Survey (CPS) is a more trustworthy way to get an estimate of current registrations. And according to my analysis with CPS data, more people voted in 2020 than the total number of registered voters. 


Analyzing the Current Population Survey, more than 100% of registered voters voted this year

Using the Current Population Survey (CPS), there is evidence of widespread 2020 election fraud. The CPS is a monthly survey of around 60,000 U.S. households that is conducted by the Census Bureau. The survey is used by the Bureau of Labor Statistics to estimate the unemployment rate, and the Census uses it to estimate population characteristics in between decennial censuses. In other words, it's a good survey.

The CPS asks people if they are currently registered to vote. Let's use its estimates to calculate the percent of registered voters who voted in presidential elections since 1960, the first year CPS asked a question about voter registration. I'll use the numbers provided here.

Percent of registered voters who voted

1960   107.8

1964     95.1

1968     89.4

1972     79.8

1976     77.7

1980     76.5

1984     74.6

1988     74.5

1992     71.2

1996     65.9

2000     67.5

2004     70.0

2008     89.8

2012     84.3

2016     86.8

While most years seem perfectly reasonable, notice how the 1960 election--the election stolen from Nixon--yields an impossible number. 95.1% voting in 1964 seems fishy, too. Election experts say that over 90% is a red flag for fraud. 

CPS has not provided 2020 numbers yet. The most recent is 2018, and it estimated 153.1 million registered voters with a margin of error at about 750,000.  If we average increases in registered voters since 1980. that is 1,027,000 per year, or 2,054,000 for two years. Perhaps 2018-2020 saw a much better than average increase. Let's be generous and say 5 million new people got registered during that time. That puts us at 158.1 million registered in 2020. The problem is, 158.4 million voted for president in 2020 according to Ballotpedia. That gives us an estimate of 100.2% of registered voters voting for president in 2020. Impossible.

A response to this is that we can simply use state counts of registered voters, and the World Population Review totals those to be 214 million. The problem with using that approach is that voter rolls are notoriously larded up with outdated or improper registrations: dead people (who ever calls the officials to let them know Granny just died), people who have moved away, etc. There are many sources of error. For example, recently in California, non-citizens were being registered to vote when they got their driver's licenses. Government seems curiously lax on cleaning up voter rolls. 

The CPS is considered a gold standard of surveys, and you shouldn't have undercounts due to people legitimately being registered but being shy about admitting it. If anything, it might be like responses about voting where people want to look good and say they voted when they did not. Registering to vote is what good citizens do.  

The 1960-2016 CPS results shown above seem valid with the clear exception of 1960, the first year the CPS asked about voter registration, and the year when an election was stolen. I'm sure methodological refinements have been made over the past 60 years. 

For 2020 to have the voting rate we saw in 2016--86.8% of those registered voting--there should be 182.5 million people currently registered. The CPS will be off by a little but not almost 25 million voters. All this suggests funny business in 2020. 

UPDATE: I show here that voter rolls are unreliable for this analysis.

Saturday, October 24, 2020

Race trumps: Race, not social class, predicts 2016 voting

You often see the argument that the central political divide is social class, not race and ethnicity. If this were true, then we should see it in voting patterns. 

The General Social Survey asked participants who they voted for in 2016, and they also asked about annual income and race. The results below are estimates from a logistic regression model that predicts 2016 voting for President with income and race. The three racial categories are white, black, and other race. Whites are the reference category and so are omitted from the model (sample size = 1,360).


From the p-values (probability) you can see that, once you adjust for race, REALINC (inflation-adjusted income) does not significantly predict who you voted for in 2016. By contrast, blacks and people of other non-white races were less likely than whites to vote for Trump, regardless of one's social class. 

Race trumps.  

Tuesday, July 14, 2020

GSS data: Trump-voting women are happier and here's why

Feminism is a form of liberation that should make you happy, right? Wrong. Here is the relationship among white women between being happy and voting for Hillary in 2016 (GSS data):


Women who voted for Trump are significantly more likely to be very happy. Marriage is probably the reason why: married white women tend to vote Republican, and married women are happier. Look:


Gloria Steinem famously said, "A woman needs a man like a fish needs a bicycle." A fish doesn't need a bicycle unless she likes being happy. 

Saturday, January 04, 2020

Are the Scots-Irish leading the way toward race consciousness?

I'm thinking that one way to measure an ethnicity's meaningfulness as a group is the extent to which they vote as a bloc. For example, why do blacks, whether wealthy or poor, urban or rural, religious or not, vote overwhelmingly Democratic? Because race is very important for them, and the vast majority see the Democratic party as best serving their interests.

The numbers shown below were calculated like this: 1) Look to see whether more of the ethnic group voted for Hillary or Trump; 2) subtract from that number the percent of all Americans who voted for that candidate; and 3) give a positive sign for those skewed toward Hillary and a negative sign for those skewed toward Trump. I included major racial and ethnic groups, and religions as well since they can also be cohesive groups (General Social Survey, sample size = 1,128).

Voting bloc index

Asian  46.5
White Southern Baptists  -45.0
White--American only  -43.3
Black   41.3
Puerto Ricans  32.2
Protestant Irish  -25.2
Scottish  -23.1
Southern Baptist  -22.0
Jewish   18.9
Mexican  17.5
Catholic Irish  -16.2
German  -14.1
Italian  -10.9
Whites  -9.9
Scandanavian  -9.4
English/Welsh   -9.2
American Indian  8.4
Slavic (non-Jewish)  -8.4
Episcopalian  -7.3
Catholic  -3.5
United Methodist   -2.9

Not surprisingly, non-whites tend to be the most ethnocentric. Asians include people whose families came from China, Japan, and India--they score even higher than blacks.

Hispanics and Jews are in the mid-range, but the striking numbers are for: 1) white Southern Baptists; 2) whites who say their ethnicity is American--Scots-Irish are likely to say this; 3) the Protestant Irish; and 4) Scots. The numbers for white Southern Baptists and for "Americans" are second and third highest on the list (!) and the scores for the other two groups are higher than that of either Jews or Mexicans.

I interpret this as an inchoate sense of identity. For other white groups or religious denominations, there appears to be weaker group cohesiveness. It's higher than zero for all groups, but the Scots-Irish seem to be leading the way on a path toward race consciousness.

Tuesday, March 26, 2019

Data: What are the best predictors of voting for Trump?

It's always exciting for nerds like me when new GSS data arrives. 2018 is now available. They asked respondents whether they voted for Clinton or Trump. I used logistic regression to determine what predicts voting for Trump (sample size = 904):

Voted for Trump 
Male  .57
Southern region  .33
Black  -3.78
Other race  -1.30
Education  -.11
Income  .01
Church attendance  .16

The coefficients are not standardized, so they can only tell you the direction of the relationships, not the magnitudes. I included age and IQ, but neither one was significantly related to vote choice.  Keep in mind that the relationships are net of the influences of the other factors included in the model, so, for example, age might predict voting for Trump because older people are whiter, wealthier, less educated and more religious, not because they grew up in an earlier era.

So here are the characteristics of people voting for Trump: male, Southern, white, less educated, higher income, with more church attendance. No surprises there. And what mattered the most in order from most to least predictive: 1) white, 2) church attendance, 3) male, 4) education, 5) income, and 6) southern residence.  Trump owes the election to religious, white males, like myself.  You're welcome.

I didn't have data on the impact of Russian colluders.


Interpreting Your Genetics Summit

Wednesday, March 06, 2019

Data: Athletes are more conservative than non-athletes

I would expect athletic people, on average, to be more conservative than non-athletes. The culture of sports and the types of individuals drawn to it are competitive and disciplined, and are likely to attribute their athletic success to their own hard work.

The General Social Survey asked participants to rate themselves athletically. This question was asked in 2004, so to look at voting patterns, we have to rely on a question about whom the respondent voted for in the 2000 presidential election. Here are the results listed by race and sex (sample size = 1,439):

Percent who voted for Bush in 2000

Whites
Athletic  63.1
Non-Athletic  53.0  
Relative risk  1.2

Blacks
Athletic  22.2
Non-Athletic  10.7
Relative risk  2.1

Men
Athletic  53.0
Non-Athletic  48.5  
Relative risk  1.1

Women
Athletic  55.1
Non-Athletic  45.9 
Relative risk  1.2

The data support my hypothesis for both race and gender.

It makes sense for conservatives to actively encourage as many kids as possible to be involved in sports. Or perhaps I should say competitive sports. A trophy for every kid is a liberal idea. 

Interpreting Your Genetics Summit

Saturday, March 02, 2019

Data: What type of immigrants vote for the GOP?

President Trump told the audience at CPAC today that the economy is so strong, we need legal immigrants to fill certain jobs, but it should be based on merit. Unless the GOP wants to become the next Dodo bird, "merit" should be the type of immigrants who vote conservative.

What kinds of immigrants are likely to vote that way?  The General Social Survey asked people which candidate they voted for in 2012.  I looked at immigrants to see what predicted voting for Romney over Obama (sample size = 192).  I looked at sex, age, race, education, IQ, income, religion, and religious attendance.  Only two factors were statistically significant: being white and religious.  Immigrants who are white and go to church often are more likely to have voted for Romney, and being white was the more important predictor.

So if the GOP wants a future, they had better stop the mass immigration of nonwhites and the irreligious.

UPDATE: 62.5% of white immigrants who attend church more than once a week voted for Romney.  By contrast, 96.3% of black immigrants and 75.0% of other non-white immigrants voted for Obama.


Interpreting Your Genetics Summit

Monday, July 11, 2016

Part of the reason Hispanics are so liberal is because they are young

I showed recently that some of the reason that Asians tend to vote Democrat is that they are, on average, younger than whites. Let's now see if this is true of Hispanics. Using GSS data, here are the percentage who voted for Romney in 2012:

Percent Voting for Romney

Hispanics
Ages 18-44  15.5
Ages 45+  24.1

Whites
Ages 18-44  47.8
Ages 45+  49.1

You can see than young Hispanics are very liberal. Older Hispanics are liberal, too, just a little less so.  The mean age of whites in 2012 was 49.4. It was only 40.9 for Hispanics, so they are a much younger group. Conclusion: Part of the reason why Hispanics are so much more liberal than whites is because they are younger, but even if their average age was that of whites, they would still be a liberal group.

Friday, July 01, 2016

Elites vote Democrat, not Republican

I'm tired of the old Democrat myth that the Republican Party is the party of elites. Looking at General Social Survey data, it's not surprising to see that only 24% of high school dropouts voted for Romney in 2012, but how many people with advanced degrees voted for him? A whopping 32%. Most highly successful people vote Democrat because their competitors aren't the poor. Their enemies are America's Middle. They seek an alliance with the poor so they have the numbers to subjugate ordinary Americans.

Thursday, May 26, 2016

Asians Americans vote Democrat because they're young (and liberal)

An interesting claim was made by Tantum Malorum on Twitter (where I spend all my time these days).  He said that Asians tend to vote Democrat because they are disproportionately young.  I looked into this with GSS data. The mean age of all voters in 2012 was 52.2. Here are the means for Asian groups listed in GSS:

Mean age
Chinese  51.1
Filipino  42.6
Japanese  45.5 
Indian  48.6
Other Asian  45.0

Mean age for all groups was lower than for the total sample, although it's not much lower for Chinese Americans. Since young people tend to vote Democrat, it could be that Asians are not more inclined to be liberal, they're just younger.

Next, let's look at voting in 2012 for: 1) young Asians, and 2) older Asians. I'm going to add all Asian groups together since sample sizes are so low.

Percent voting for Romney

Ages 18-44  
All voters  32%
Asian voters  25%

Ages 45 and up
All voters  40%
Asian voters  38%

First of all, it looks like the numbers are lower than they should be. GSS oversamples women, so this might be a problem.

Anyway, 25% of young Asians voted for Romney, compared to 32% of all young people. For older Asians, there is only a two point gap with all older voters.

So, it looks like the Asian vote is tilted Democrat because they are a younger population, but they are a little more liberal as well.

The numbers are too small to make much of it, but of the Asian groups, Indians were noticeably more likely to vote for Obama.

Sunday, April 24, 2016

Race is more powerful than income

Marxists tell us that money is more powerful than anything else. I'm not so sure. Watching the primaries has reminded me of the power of race.

Which predicts voting patterns better: income or race/ethnicity?  I want to compare all large ethnic groups in America, so let's choose Americans (like myself) of English descent as our comparison group since they were mostly likely to vote for Romney in 2012. For the first comparison, let's look at blacks. I ran a regression that includes this racial dichotomy along with income as predictors, voting for Obama over Romney as the outcome variable, and I list the standardized coefficients below:

Black  .60
Income  -.05

Income does not predict voting, but race is an extremely powerful predictor: Blacks were MUCH more likely than English-Americans to vote for Obama. Let's do those of Chinese descent next:

Chinese  .13
Income  -.08

Being Chinese (instead of English) had a stronger effect: It predicted voting for Obama more strongly than did poverty. Now let's look at an important ethnic group: Jews.

Jewish  .23
Income  -.09

Even with the small racial difference, being Jewish rather than English was a much better predictor of voting behavior than income.  We're getting the picture here that race is a more powerful determinant of behavior, at least in the context of politics.

Here are the results for the other racial comparisons (all groups are compared with Americans of English descent):

Mexican  .39
Income  -.13

Japanese  .12
Income  -.13

Asian Indian  .23
Income  -.10

Puerto Rican  .21
Income  -.11

West Indian .13
Income  -.13

Arab  .07
Income -.12

American Indian .18
Income  -.15


You can see that for Mexicans, Asian Indians, Puerto Ricans, and American Indians, race determines political orientation more than income. Race is just about as powerful as class for the other groups.

Economic determinists would predict that the race-voting correlation would disappear when income is controlled, but we see that income is the weaker influence.  Removing the effect of income, minorities seem to vote out of fear, as if their security or values might be undermined if Republicans get too much power.  (I didn't control for urbanness which might be another factor.)


Monday, February 22, 2016

Non-whites saving us from the socialism of young white idiots!


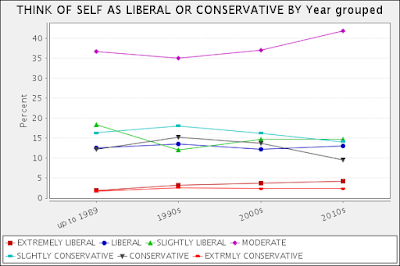
In an earlier post, Jayman wrote that non-whites shouldn't be characterized as liberal but as more likely than whites to vote for Democrats. This graph shows self-descriptions for non-whites. As Jayman suggests, a plurality--more than 40%--describe themselves as moderates, and that number has grown a bit over the past 2 decades. Twenty-one percent currently say liberal or very liberal.

Maybe the large number of non-white moderates helps explain the strong support for Hillary. Non-whites seem to be saving us from the socialism of young white idiots!

Monday, February 15, 2016

Millenials are more liberal because they are less white


I've read studies that suggest that Millenials are significantly more liberal than previous generations of young people. It makes me wonder, is that due to more non-whites, or are young whites more liberal?

The above graphs shows trends for males 18-29. The clearest change is an increase in moderates. You can also see a small drop in the number of those who are conservative or slightly conservative.


This graph is of young females. There are no large changes for them. It looks like most of the liberalism in this generation of young people is due to the growing number of non-whites. 


Bernie's mistake

Although there has been some move by blacks and Hispanics toward Bernie Sanders, it has not been as dramatic as I expected. I've been wondering why so many of these people would pick Hillary over a socialist--someone who sounds so generous. Perhaps the problem is that Bernie might be best known for proposing free college. White liberals LOVE the idea, but if I'm an ordinary black guy, what do I care about college? Bernie would do much better if he proposed sending each black person a check because of the burden of being black.

By the way, as a professor, I hate the idea of free college even though it would improve my job security. I already have way too many students who shouldn't be in college, and this would make the problem much worse.

Thursday, February 11, 2016

Wednesday, February 03, 2016

Small move to the left among liberals


Seeing so many democratic socialists in the Iowa Caucus disturbed me.  I wanted to see if this is part of a larger trend of liberals moving left. The green areas show that the percent of liberals who say they are extremely liberal has stayed at around 14% for more than a decade. Where we see change is the move away from slightly liberal to liberal. In 2002, 41% said they were liberal. In 2014, this had increased five points to 46%.

This is consistent with other data I've seen that the country (just like the national leadership) is more polarized--fewer people in the middle.

We'll have to watch whether Bernie can convince liberals in the South (i.e, blacks and Hispanics) and beyond to vote for him. If he does, this country is more open to European-style socialism than I thought.

Friday, January 29, 2016

White voting by ethnic group

According to this video by Stefan Molyneux, white people tend to prefer smaller government. I would agree that whites might be unusual in wanting to protect the individual against the state, but Europeans and all those white Bernie Sanders voters are certainly comfortable with confiscating lots of your money.  Whites seem to be more live-and-let-live, but many of them want to soak the rich just like everyone does.

Whites are so diverse, let's get a little more precise and see which American white groups are majority Republican currently. Based on GSS data:

Percent voting for Romney in 2012

Dutch  76.2
English/Welsh  56.5
Scottish  54.5
French  52.2
German  52.0

Polish 42.4
Irish  42.2
Swedish 42.1
Italians  36.2
Jewish  32.4

Protestants and groups that have lived longer in the United States are more likely to vote Republican. Folks like me (English in my case) might feel a stronger connection to the country's traditions than more recent groups.

I suspect we would be more collectivist like Europe if we were a racially more homogenous country. If the recipients of government assistance look like they could be a cousin, we might be more in favor of it. But if we drum up an image of someone unconnected to ourselves when we think of welfare, we think, why help them? We sense that we are sharing with a competitor.

Thursday, January 28, 2016

The Muslim vote

What idiots ever thought that immigrants would rush to vote for Republicans because they hold traditional values? I'm not sure if they have been idiots or conmen.

Just look at how Muslims have voted in the last few elections. No one should be more socially conservative than Muslims:

Percent voting for the Democratic presidential candidate

2008  Obama 83
2004  Kerry 100
2000  Gore 71
1996  Clinton 100
1992  Clinton 100

Sample sizes are very small, but the picture is very clear.  Even before 9/11, Muslims overwhelmingly voted for the Democrat. When it comes to voting, they don't give a crap about traditional values.

Are gun owners mentally ill?

  Some anti-gun people think owning a gun is a sign of some kind of mental abnormality. According to General Social Survey data, gun owners ...